


You’ve probably heard the famous quote, “Half the money I spend on advertising is wasted; the trouble is I don't know which half.” It was John Wanamaker, a pioneer of some of the techniques in modern marketing, who said that, over a hundred years ago, but it’s still a sentiment that we often hear from many musicians.
Fortunately, it doesn’t have to be that way. Today, musicians have access to powerful marketing insights, via tools like Spotify for Artists, that would have astonished Mr. Wanamaker.
The best part about Spotify for Artists, in particular, is that in addition to being free, it helps answer questions that musicians have always been asking: Who are my fans? What do they like about my music? What else are they listening to? What music should I make next?
In this post, we’ll give you the lowdown on the analytics in Spotify for Artists. We’ll demystify what the various data types actually mean, and break down how you can use them to multiply your fans, regardless of what stage of growth you’re at as an artist. You could also check out this game-changing tutorial outlining some real out-of-the-box strategies on growing your Spotify following in 2024.
But first…
As a Musician, Do You Really Need to Bother With Data and Analytics at All?
Let’s face it, most people become musicians because they want to make music, not because they’re crazy about marketing tasks like discovering the right audience and using data to increase popularity and commercial success.
But the notion that, “If you make it, they will come” — “it” being the music, and “they” being your target audience — is one of the biggest myths in the industry. It’s why so many up-and-coming artists really struggle with finding and growing an engaged audience.
To be clear, we’re not recommending putting the cart before the horse. Perfecting and improving your sound is always priority numero uno. But if you’re wondering why your music isn’t winning as many listeners as you were hoping for, there’s a fair chance that the key to growth lies in how you’re promoting your music and who you’re pitching to, rather than in the music itself.
The importance of data, analytics, and digital marketing, for musicians to find the right audience in the streaming music landscape is best demonstrated by a case study in The Long Tail, a book by Chris Anderson (the former editor of Wired magazine).
Anderson recounts how a record label wanted to launch Bonnie McKee, a new artist at the time. Based on McKee’s background, the label believed she should be pitched to listeners of adult contemporary music, primarily women between 25 and 35.
The launch didn’t go very well, and Anderson quotes the executive who ran the campaign:
“What we’ve learned is that if a band builds an online fan base first, they have a better chance [of success]. … Many artists who don’t do that ... fail … [because in such cases] the fans aren’t invested in the artist, just the song.”
Here’s the rub, though: most musicians recognize that building a fan base is important. But if you don’t know who your followers are, winning engaged listeners can be an uphill battle, and a huge portion of the time and money you spend promoting your music will be wasted.
In McKee’s case, when the label released her songs on a music streaming platform, they discovered that her music actually appealed to a far younger audience than they’d imagined — the data showed that almost half of her listeners were under the age of 17.
Trying to pitch McKee to 25+ women, when her real listeners were 13- to 17-year-olds, is like trying to market Hello Kitty handbags to corporate executives — it’s not going to work very well.
In short: your audience is out there, somewhere in the big, wide world. You just need to find them. Data can help you do that. Let’s see how.
Spotify for Artists Analytics Explained
From the Spotify for Artists dashboard, there are two views that we are primarily interested in: the Music page and the Audience page.
Let’s break each of these down.
The Music Page
From the Music page, you can access:
- The Songs view, where you can find all of the tracks you’ve released under your account to date.
- The Releases tab, where tracks released less than 7 days ago have live (real-time) data.
- The Playlists tab, where you can see playlists on which your tracks have been featured, including algorithmic, editorial, and user / listener playlists.
Songs and Releases
As you may have noticed, both Songs and Releases have the same columns of data:
- Streams: the number of times a track has been played for 30 seconds or longer.
- Listeners: the number of users who've played a track.
- Views: the number of times a track's Spotify Canvas cover video has been seen by users.
- Saves: the number of users who've saved the track to their Spotify.
- First Released: the date on which the track was released on Spotify.
As mentioned earlier, the data in the Songs tab are only updated once every 24 hours, whereas Releases shows real-time data.
By default, all columns are set to display data for the last 28 days, but the drop down above the columns lets you view data for the last 24 hours, 7 days, and data since 2015.
On the Songs tab, you can download the data in CSV format by clicking on the downward arrow icon next to the timeframe drop down box. You can then work with this CSV data using a spreadsheet program like Microsoft Excel or Google Sheets. This is particularly useful, because date-wise stats are only available for some of the fields, and only some of the time.
For example, stats for the number of saves and listeners is only available in aggregated form (not date-wise), and the CSV export feature doesn’t include these fields either. This can get a little confusing, so the table below will help you understand which types of track-level data you can always access via your dashboard.
|
Trackwise streams |
Trackwise listeners |
Trackwise views |
Trackwise saves |
Trackwise playlist adds |
|
|
Last 24 hours |
✔ |
✔ |
✔ |
✔ |
✔ |
|
Last 7 Days |
✔ |
✔ |
✔ |
✔ |
✔ |
|
Last 28 days |
✔ |
✔ |
✔ |
✔ |
✔ |
|
Since 2015 |
✔ |
✔ |
✗ |
✗ |
✔ |
|
Date-wise |
✔ |
✗ |
✗ |
✗ |
✗ |
|
Available for export |
✔ |
✔ |
✗ |
✗ |
✗ |
As you can see, date-wise stats are only available for streams. What this means is:
Accurately measuring performance over time requires manually copying the date-wise stats for listeners, views, saves, and playlist adds, from the Spotify for Artists dashboard once every 24 hours.
This may seem tedious, but if you’re promoting your music using social media ads, or other campaigns such as PR and blogging, date-wise performance tracking is crucial to understand how effectively each of your campaigns is fulfilling your objectives.
For example, suppose that a particular Facebook campaign increases the streams for a particular song, but does nothing for saves. Meanwhile, say a guest blog or podcast appearance increases streams only modestly, but gives a big spike in saves. Without date-wise tracking, it would be hard to later figure out what worked best.
If that sounds complicated, don’t worry. We’ve made it super-easy with a spreadsheet where you just copy and paste your data, and the spreadsheet does everything else for you. But before we get into that, let’s look at the data in the Playlists and Audience sections.
Playlists
The Playlists tab under the Music section shows all the playlists that your tracks have been featured on recently, and the traction you’re getting with each of them. Playlists are an incredibly important source of streams, new listeners, and saves, so it’s worth your while to monitor how these evolve and progress over time.
Spotify shows data for three types of playlists:
- Algorithmic: These are AI-generated playlists, also called personalized playlists. As the name suggests, these are personalized for each user, so what I see on my Discover Weekly playlist might be completely different from what anybody else sees. For some genres of music, like Pop, Algorithmic playlists can be a huge source of streams.
- Editorial: These are curated playlists made by editors at Spotify. These are the hardest to get on to, and also tend to drive the most streams and listeners.
- Listener: These are user-generated playlists created by third-party Spotify users. Some of them are extremely popular and can bring as much or more of a boost than Editorial lists.
You can download CSV data for these too, but they don’t include date-wise metrics, so manual tracking will be essential.
The Audience Page
Similar to the Music section, the Audience page also has data on Listeners and Streams under the Stats tab. But in this view, these data are aggregated for the whole artist / band; track-level data is not available here.

The Stats tab also shows data on Followers, which is the number of people who have Liked your artist profile.
Further, the Stats tab provides these extremely useful data types:
Source of streams: See where you’re getting the most streams from, between:
- your profile
- your audience's own playlists
- third-party playlists
- editorial playlists
- algorithmic playlists
- other sources
Listeners' gender and Listeners’ age: This is probably the second-most important piece of data here. For example, a recent survey found that while K-Pop is mainly popular with Gen Z listeners in the US, in Korea, it has a wider audience base that includes Millennials and even Gen X listeners. Knowing this will help shape your marketing decisions.
Listeners also like: We think this is the most valuable insight you can get from Spotify. While it’s possible to arrive at demographic data from other sources, such as social media analytics, figuring out what other artists or types of music your listeners like the most is fairly difficult to do elsewhere.
For example, the musical group slenderbodies used to think of themselves as indie pop artists. But their Spotify data showed that their listeners really listen mainly to electronic music like chill pop and chill vibes, which was useful not just in figuring out listener preferences, but also informative in deducing that their fans probably most appreciate the aspect of their music that blends electronic with organic styles.
Top countries and Top cities: The names are fairly self-explanatory, and these are crucial data points to know where your listeners are, influencing marketing choices (maybe you should pursue getting some PR coverage in Portugal, if many of your listeners are there!) and even things like tour dates.
South African electronic sensation, The Kiffness, learnt that a huge portion of his fans are based in Russia — which suggests a completely different set of promotional choices than if they were in, say, Canada, or the UK.
All put together, this is a lot of data to track, and if you have multiple singles and albums out that are all different ages, trying to make the best data-driven choices to maximize your audience base and streams can quickly become overwhelming. Which brings us to…
Spotify for Artists: Free Data Analytics Tool
To simplify monitoring and analyzing your data, we’ve created a nifty tool in the form of a powerful, free Google Docs spreadsheet that does all the number-crunching for you!
Just select the tabular data from your various Spotify for Artists screens, and paste them into the spreadsheet each day, and the sheet will instantly display the report for you, with all the important metrics you need!
Audience Insights You Can Get From Our Free Spotify Analytics Tool
1. Day, Month, Quarter, and Year-wise Listener Tracking
![]()
The tool automatically generates date-wise reports for listeners based on the data you paste from your dashboard. Unlike the data in Spotify for Artists, this allows you to slice and dice listener data to get both, granular detail, as well as the big picture, which will help you answer questions like how well a song is doing over time, whether a track is suddenly gaining or losing listeners, what times of the day, month, or year, are most effective for promoting a track, and so on.
2. Stream Rate Over Time
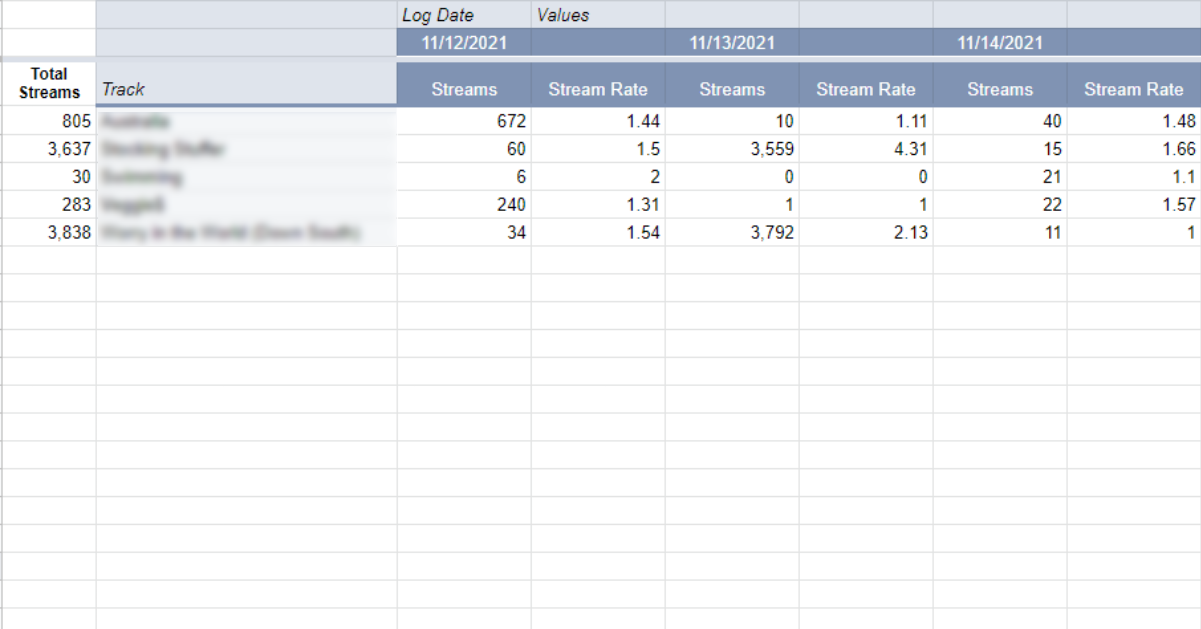
The number of times a user plays a song is what we call the ‘stream rate’. It’s calculated by dividing the total streams by total listeners for a given timeframe. For example, say a track gets 3,000 streams, and has 935 listeners. This means, on average, users listened to this track 3.2 times: i.e, the track’s stream rate for that time period is 3.2.
A relatively high stream rate might indicate that an audience likes a song more than others, but in our opinion, the data point listed next is even more important.
3. Save Rate Over Time

The save rate of a song is the ratio of the number of listeners who save a song relative to the total number of listeners for that song. Save rate is an even more important metric than stream rate, because a user can listen to a song a thousand times, but can only save it once.
Spotify’s algorithms recognize this too, which is why songs with high save rates make it into their playlists more often.
4. Playlist Placements Over Time

As we mentioned earlier, getting featured on playlists is vital to growing your streams and succeeding on Spotify. Once you paste your Playlists performance data into this tool, you can easily track which playlists are working well for you, with breakdowns by song and by date.
Similar to Spotify’s Listeners also like data, listener playlists provide important insights into how people categorize and feel about your music. If your soft rock track ends up being featured on, and getting a lot of streams from, punk rock playlists — well, then you know what your listeners actually like about your song.
5. Dynamic Charts and Data Visualization

Using the reports generated by this tool, you can easily create charts to visualize your data to make sense of how all of your music is performing over time. In case you’re not familiar with charts, this video makes it really easy to create charts in Google Sheets.
How to Use Our Free Tool
Step 1. To use the spreadsheet, open the link when signed in to your Google account. Then, click File > Make a copy to add the sheet to your own Drive account.
There are 10 “pages” or worksheets in the Google spreadsheet:
-
Demo: This is a page with some demo data, just to show you how it might look once you’ve put in your own data.
-
Page 1: This is where you paste your data from the Songs tab of your Spotify Music section. Make sure that you’re in the Last 24 hours view before copying the data.
-
Pages 2, 3, 4: These pages are where you paste your data from the Playlists tab. Algorithmic playlists in page 2, editorial playlists in page 3, and user or listener playlists in page 4. Again, ensure you’ve chosen the Last 24 hours view.
-
Listeners, Streams, Saves, Playlists: These are report pages, where reports are automatically generated once you paste your data.
- Page 5: This is a calculation / aggregation sheet which is hidden by default, because you don’t need to edit or view anything on this page.
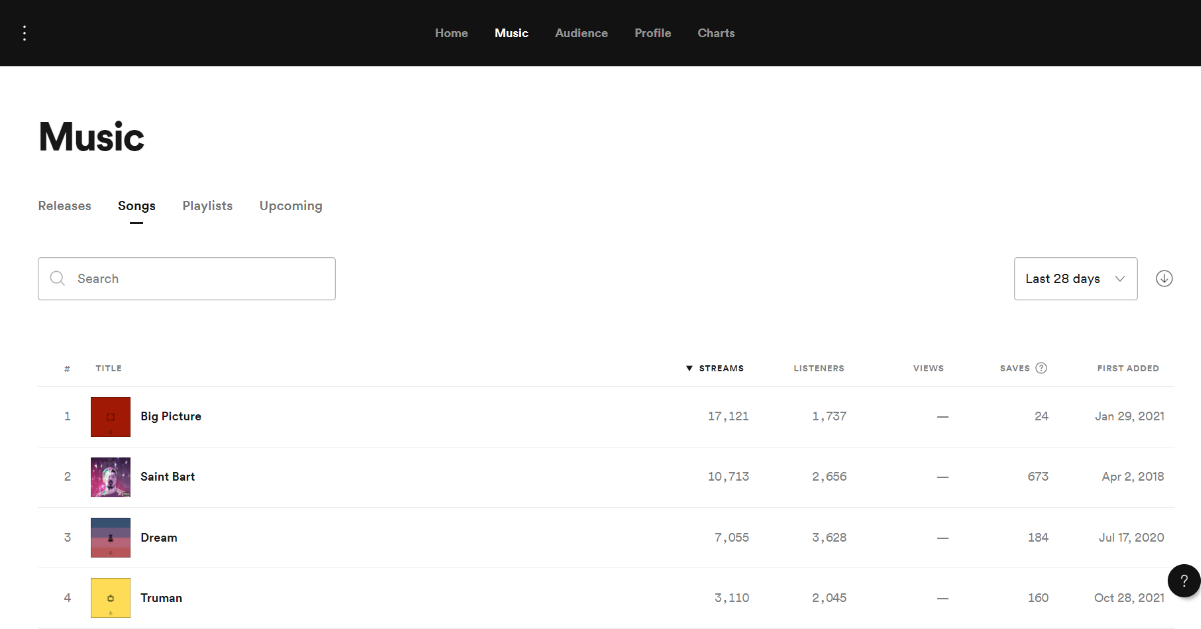
Step 2. Now, log in to your Spotify for Artists dashboard, and copy the data from Music > Songs > Last 24 hours. Make sure you don’t copy the column headers, as shown in the image below.
Paste this data from column A of the next blank row of page 1 in your spreadsheet.

Click and drag the cursor from just after the ‘First Added’ to select data excluding column headers
Tip: When pasting data in Google Sheets, if the formatting looks a bit funny, trying using Edit > Paste special > Values only to paste your data without the formatting. Or, you could also try selecting the data you want to modify and using Format > Clear formatting to remove special formatting after you’ve pasted the data.
Step 3. Similar to step 2, repeat the copy-paste process to put in your Playlists data for Algorithmic, Editorial, and Listener playlists, on pages 2, 3, and 4, respectively, in your spreadsheet.
Tip: When pasting Playlists data, you’ll need to manually type in or copy-paste the name of the song in the Track Name column (H). By default, Spotify clubs this data with the name of the playlist, so the tool won’t be able to calculate trackwise playlist performance without this.
And that’s it! You can now switch to the report pages in the spreadsheet to view reports.
Using the Data for Actionable Steps
Here’s a quick recap of how to use this data to grow and nurture your fan base.
-
Save rate: Monitor this to increase your listeners and streams. Any time you see a spike in save rate, figure out whether it was driven by a social media ad, a playlist placement, or some other event. Whatever it was, try doing more of it. Also look at the region the saves came from, because there are likely even more fans in that place, waiting to discover your music.
-
Spikes in streams: If you see any sharp upward or downward changes in your streaming stats, try to correlate it with where those listeners are (or were) coming from. For instance, a social media campaign driving a lot of streams might show you where your listeners are coming from, and how to pitch yourself to them. Or a song that drops after being removed from a playlist might be a good time to look at your audience graph to see which region had the biggest drop.
-
Demographic and ‘Also liked’ data: Combine these to gain a picture of your listeners’ age, gender, location, and what else they’re listening to. If you find that your album is actually trending with millennial and Gen Z listeners, maybe it’s best to focus on TikTok and Snapchat, rather than other platforms.
And if they also like Sabaton and are mostly from Sweden, you know what they like about your music, and what kind of video to release next to win more streams and followers.
Next Steps
This article helped you get on your way with Spotify for Artists data analytics, but it’s really just the beginning of music marketing. To grow your fan base — and your revenue — check out our free tools for musicians, and other resources.


